
Business
Tennessee Titans Depth Chart 2026: Full Roster Breakdown by Position

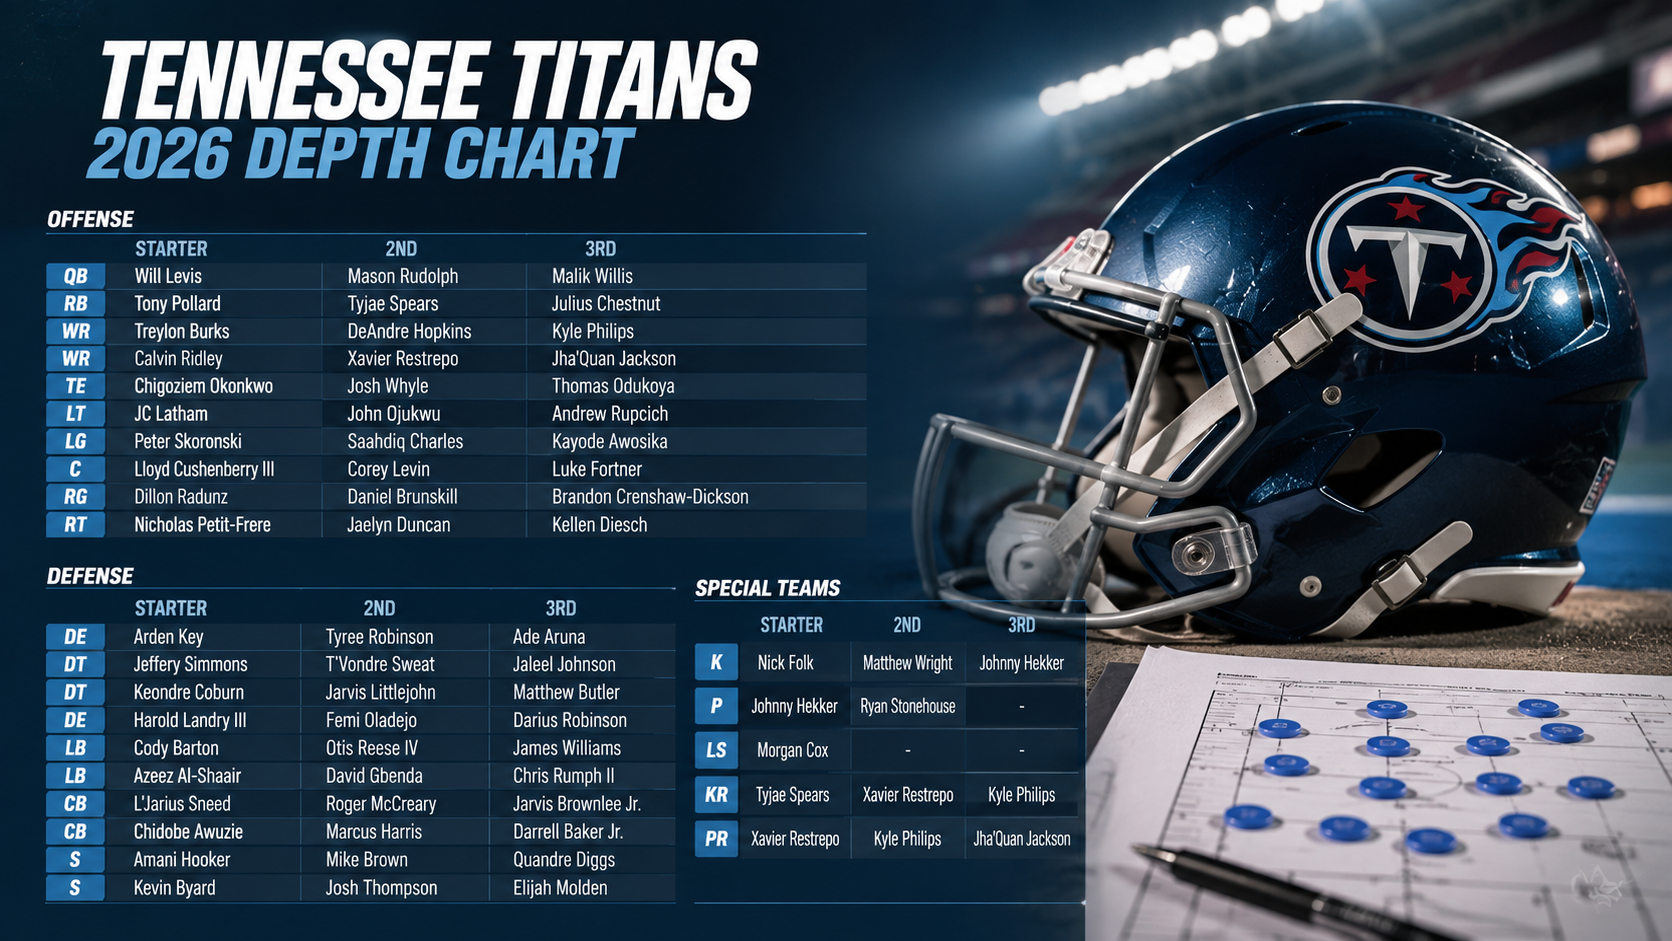
There is a genuine sense of transition surrounding the Tennessee Titans heading into 2026. After a brutal 3-14 record in 2024, the team landed the first overall pick and used it on quarterback Cam Ward. Now the question fans, fantasy managers, and football analysts keep asking is simple: who is actually on this roster, and where does everyone stand?
The Titans depth chart heading into 2026 looks meaningfully different from even a year ago. New faces at quarterback, reshuffled skill positions, a rebuilt offensive line, and a retooled defense make this one of the more interesting rosters in the AFC South to break down. Whether you are tracking this for fantasy football or just want to understand where the Titans stand as a team, here is everything you need to know.
Quick Answer
The 2026 Tennessee Titans depth chart is led by Cam Ward at quarterback, with Mitchell Trubisky as the primary backup. Tony Pollard leads the backfield ahead of Tyjae Spears, while the wide receiver group features Carnell Tate, Wan’Dale Robinson, and Calvin Ridley. Gunnar Helm is the top tight end. On defense, Jeffery Simmons anchors the defensive line, with Cedric Gray and Cody Barton at linebacker and Amani Hooker at safety.
Quarterback: The Cam Ward Era Begins
This is where everything starts for the Titans in 2026.
Cam Ward is the unquestioned starter, and the team signed veteran Mitch Trubisky specifically because of his familiarity with new offensive coordinator Brian Daboll.
Ward showed plenty of flashes as a rookie in 2025 despite not having much help, and should only be better going forward. Ward showed up to camp noticeably slimmer, reportedly having lost 10 pounds over the offseason, and has already appeared to build good chemistry with Wan’Dale Robinson and Carnell Tate.
Trubisky was brought in to fill the QB2 role behind Ward, bringing plenty of starting experience including in the postseason.
Will Levis — the former second-round pick who started 21 games across the previous two seasons — is also on the roster but his future with the team is uncertain. This offseason, the Titans added two more quarterbacks in free agency, and there is a chance it could spell the end of Levis’ time in Tennessee altogether. Hendon Hooker is also in the mix as a player looking to improve his stock during the preseason.
QB Depth Chart:
- Cam Ward (Starter)
- Mitchell Trubisky
- Will Levis
- Hendon Hooker
Running Back: Pollard Leads, Spears Pushes
Tony Pollard survived a competition scare and remains the lead back, with Tyjae Spears firmly in the No. 2 role. Fifth-round rookie Nick Singleton needs to improve his vision, while veteran Michael Carter and Julius Chestnut will be fighting for a fourth roster spot.
Pollard is a proven dual-threat back who can contribute both as a runner and a pass catcher out of the backfield. Spears flashed genuine playmaking ability earlier in his career and gives the Titans a capable change-of-pace option who can stay on the field on passing downs.
RB Depth Chart:
- Tony Pollard
- Tyjae Spears
- Nicholas Singleton
- Michael Carter / Julius Chestnut
Wide Receiver: Built Around a Young Core
The Titans wide receiver group has undergone significant reshaping, with an eye toward the future.
Carnell Tate needs to be the top guy as soon as possible, and Wan’Dale Robinson should be a high-volume weapon from the slot. Calvin Ridley took a pay cut to stay and should start out third, with Chimere Dike and Elic Ayomanor serving as the fourth and fifth options.
Tate is the young receiver the organization is betting on as a future No. 1 option. Robinson’s slot work is well-suited to complement Ward’s quick-release tendencies. Ridley is a veteran presence who adds dependability even if he is no longer the primary target.
WR Depth Chart:
- Carnell Tate
- Wan’Dale Robinson
- Calvin Ridley
- Chimere Dike
- Elic Ayomanor
Tight End: Helm as the Lead Option
Second-year tight end Gunnar Helm is the most well-rounded option and should be at the head of the line, though newcomer Daniel Bellinger received good money and could serve as the starter in bigger blocking situations.
Kylen Granson provides depth as a third option. This is a position group the Titans will look to develop further as Ward continues to grow — tight ends are often a quarterback’s most reliable security blankets, and having a capable group matters early in a young passer’s career.
TE Depth Chart:
- Gunnar Helm
- Daniel Bellinger
- Kylen Granson
Offensive Line: Rebuilt for Ward
One of the most significant priorities this offseason was protecting the franchise quarterback. The Titans shored up their offensive line by adding guard Kevin Zeitler and tackle Dan Moore Jr. during free agency, completing a full makeover that also included JC Latham and Lloyd Cushenberry from the previous year’s draft and free agency moves. Sportskeeda
A quarterback can only develop when he has time to throw. The Titans clearly understood that investing in the offensive line was non-negotiable heading into the Ward era.
Defensive Line: Simmons Anchors Everything
The team’s best player is Jeffery Simmons, who could thrive even more in a new defensive scheme, and he has a great new partner in John Franklin-Myers. Behind them is solid depth with Solomon Thomas and Jordan Elliott.
Simmons is one of the best interior defensive linemen in the NFL when healthy, and pairing him with Franklin-Myers gives the Titans a legitimate two-man core on the interior.
DL Depth Chart:
- Jeffery Simmons
- John Franklin-Myers
- Solomon Thomas
- Jordan Elliott
Edge Rusher: Looking for Production
The core four at edge rusher should be Jermaine Johnson, Jake Martin, Keldric Faulk, and Femi Oladejo. It is more about who plays more snaps than who is listed first, with rookie Faulk and second-year Oladejo needing to develop and win playing time. Paulkuharsky
Edge rushing was a clear weakness for Tennessee in 2024, and the team ranked 30th in total team sacks that season. Generating consistent pass rush pressure is one of the bigger question marks on this Titans depth chart heading into the season. Sportskeeda
Linebacker: Gray and Barton in the Middle
As the Titans will be in nickel or dime the vast majority of the time, they will play two linebackers most often. Cedric Gray is the Will linebacker and Cody Barton will need to hold off Anthony Hill as the Mike. When they need a strongside player, all three will likely be on the field.
This is a position group that will need to be sound in coverage as much as in run stopping, given modern NFL offensive tendencies.
LB Depth Chart:
- Cedric Gray (Will)
- Cody Barton (Mike)
- Anthony Hill (competing for snaps)
Cornerback: A Rebuilt Secondary
Both outside cornerback starters were free-agent acquisitions: Alontae Taylor and Cor’Dale Flott, with incumbent nickel corner Marcus Harris in line for the increasingly important role again. Joshua Williams is the chief outside backup, where the Titans are thin at that spot.
Nickel cornerback has become one of the most important positions in modern NFL defenses, and Harris brings familiarity with the system. Taylor and Flott give the team outside starters, though the depth behind them is something to monitor as training camp progresses.
Safety: Hooker and Winston Starting
Kevin Winston and Amani Hooker are the starting safeties, with Tony Harris third and likely to be the big nickel. Depth is an issue to be sorted out.
Hooker is a proven veteran at the position and the most experienced piece in the Titans secondary. Winston is a younger player the team is counting on to develop alongside him.
Special Teams
Joey Slye returns to handle kicking duties with Morgan Cox as his holder, but the Titans switched punters, bringing in Tommy Townsend. All-Pro punt returner Chimere Dike will try to match or surpass his standout rookie season as a return specialist.
Dike’s return ability was one of the genuine bright spots for Tennessee in 2025, and keeping him active in that role makes sense as long as his wide receiver development continues on track.
What the Titans Depth Chart Tells Us About 2026
A few things stand out when you look at this roster as a whole.
The quarterback situation is settled in a way it has not been for years. Ward is the unquestioned starter and the organization has clearly committed to building around him. That clarity matters — it filters into every other decision on the roster.
The offensive skill positions are a blend of veterans and youth. Ridley provides experience, Tate and Robinson provide upside, and Pollard gives Ward a reliable check-down option in the backfield. The group is not elite, but it is functional enough for a developing young quarterback.
Defensively, the Titans depth chart has more talent than it did a year ago, though edge rushing remains the most pressing concern. Simmons is a genuine anchor, but generating consistent pressure from the outside is the difference between a respectable defense and a dominant one.
Common Misconceptions About the Titans Depth Chart
Will Levis is still the starter
He is not. Ward is firmly the starter, and Levis is behind both Ward and Trubisky on the current depth chart. Levis missed the entire 2025 season due to shoulder surgery and his roster spot for 2026 is not guaranteed.
The Titans are a year or two away
That may be understating the potential. Ward showed plenty of flashes as a rookie and new teammates and coaches have been raving about him, with early reports suggesting he may have a full-on breakout in 2026.
The depth chart is locked in
Preseason competition will shift things. Several position battles — particularly at linebacker, cornerback depth, and the running back group beyond the top two — will play out through training camp and the preseason games.
Key Facts About the 2026 Titans Depth Chart
- Cam Ward, the first overall pick in 2025, is the unquestioned starting quarterback
- Mitchell Trubisky was signed this offseason specifically to serve as the veteran backup
- Will Levis missed all of 2025 due to shoulder surgery and his future with the team is uncertain
- Tony Pollard leads the backfield with Tyjae Spears as the primary backup
- Carnell Tate is being developed as the long-term No. 1 wide receiver
- Jeffery Simmons remains the anchor of the defensive line and the team’s best defender
- The offensive line was significantly upgraded in free agency to protect Ward
- Chimere Dike is the starting punt returner after a strong rookie season in that role
FAQ: Tennessee Titans Depth Chart
Who is the Titans starting quarterback in 2026?
Cam Ward, the first overall pick in the 2025 NFL Draft, is the starting quarterback. Mitchell Trubisky is his backup, followed by Will Levis and Hendon Hooker.
Where does Will Levis stand on the depth chart?
Levis is currently third on the quarterback depth chart behind Ward and Trubisky. After missing the entire 2025 season with a shoulder injury, his long-term future with the Titans is uncertain heading into 2026.
Who is the Titans starting running back?
Tony Pollard is the starter, with Tyjae Spears as the primary backup. Rookie Nicholas Singleton and veterans Michael Carter and Julius Chestnut round out the group.
Who are the Titans starting wide receivers?
Carnell Tate leads the group, with Wan’Dale Robinson as the primary slot receiver and Calvin Ridley in the third spot. Chimere Dike and Elic Ayomanor provide depth.
Who starts at tight end for Tennessee?
Gunnar Helm is the top tight end heading into the season, with Daniel Bellinger serving as a capable alternative in heavier formation packages.
What does the Titans defense look like in 2026?
Jeffery Simmons anchors the defensive line alongside John Franklin-Myers. Cedric Gray and Cody Barton play linebacker. The secondary features Alontae Taylor and Cor’Dale Flott at corner, Marcus Harris in the slot, and Amani Hooker and Kevin Winston at safety.
Where can I find the official Titans depth chart?
The Tennessee Titans post an unofficial depth chart on TennesseeTitans.com. ESPN, CBS Sports, and RotoWire also maintain updated depth charts throughout the season.
Key Takeaways
- The Titans depth chart entering 2026 is built around Cam Ward as the long-term franchise quarterback
- Mitchell Trubisky provides veteran stability at backup QB; Will Levis’ roster spot is uncertain
- Tony Pollard leads a capable running back group with Tyjae Spears as the clear No. 2
- Carnell Tate, Wan’Dale Robinson, and Calvin Ridley form the core of the wide receiver group
- Gunnar Helm is the lead tight end with Daniel Bellinger adding blocking versatility
- The offensive line was significantly upgraded to protect Ward in his second season
- Jeffery Simmons is the defensive cornerstone, with edge rush production the biggest open question
- Special teams feature returning kicker Joey Slye, new punter Tommy Townsend, and All-Pro returner Chimere Dike
The Titans depth chart in 2026 tells the story of a team in deliberate transition. The foundation is being laid thoughtfully around a young quarterback, the roster has more real NFL talent than it did a year ago, and the coaching staff now has the personnel it wanted. Whether Ward can make the leap and translate that potential into wins is the central question — and the answer will define what this organization looks like for years to come.

Bees are in trouble. Habitat loss, pesticide exposure, and climate change have been chipping away at pollinator populations for decades, and the effects ripple far beyond the garden. Roughly 75% of global food crops depend on animal pollinators, and close to 90% of the world’s wild flowering plants rely on them to reproduce. Those aren’t abstract statistics — they’re the reason people are increasingly looking for practical ways to help at the local level.
That’s where the bee buddy concept comes in. It’s a simple but genuinely useful idea that has been gaining traction in home gardens, schools, and urban green spaces across North America and beyond.
What Is a Bee Buddy?
The Quick Answer
A bee buddy refers to a localized, hands-on approach to supporting bee health in residential, urban, and suburban environments. It typically combines three elements: a nesting structure (often called a bee hotel or nesting box) to house solitary native bees, a curated selection of bee-friendly flowering plants providing nectar and pollen across multiple seasons, and a clean water source. Together, these elements create a small but meaningful habitat patch for native bee species.
Why Bee Buddies Matter
The term “bee” tends to bring one image to mind — the honeybee, the iconic hive-dwelling species that produces honey and features in most people’s mental picture of pollination. But the United States alone is home to more than 4,000 native bee species, the vast majority of which are solitary. Mason bees, leafcutter bees, sweat bees, bumblebees — each plays a distinct role in local ecosystems, and many are actually more efficient pollinators than honeybees for specific plants.
These native species are also the ones most impacted by habitat fragmentation. Unlike honeybees, which are managed by beekeepers, native bees have to find their own nesting sites, forage for their own food, and survive entirely on what the surrounding landscape offers. When that landscape is mostly pavement, lawns, and ornamental plants with little pollinator value, they struggle.
A bee buddy setup addresses exactly this problem at the neighborhood scale. It provides the nesting habitat, food sources, and water that native bees need — in a space as small as a balcony container garden or as large as a backyard meadow.
A pilot study conducted in Portland, Oregon, tracking residential areas that actively implemented bee buddy strategies found a measurable 15% increase in local solitary bee species diversity within two years, compared to control groups that made no habitat changes. Small interventions can add up.
The Three Core Elements of a Bee Buddy Setup
1. The Nesting Structure
The most visible component of a bee buddy system is often the nesting box — sometimes called a bee hotel. These structures provide ready-made cavities that solitary bees use to lay eggs and raise their young.
A few important things to understand about bee hotels:
Solitary bees are not the same as hive bees. Mason bees, leafcutter bees, and other solitary species don’t form colonies and don’t produce honey. The female lays eggs in individual tubes or cavities, seals them with mud, leaves, or plant material, and the larvae develop inside. These bees are also stingless or extremely unlikely to sting — they have no hive to defend.
Design matters more than most people realize. Poorly constructed or maintained bee hotels can cause more harm than good by harboring parasites and moisture that kill developing larvae. Key design principles include:
- Natural, untreated wood is preferred over plastic. Bamboo and paper tubes work well because they can be replaced annually, which is critical for parasite control.
- Tube diameter variety is important — different bee species prefer different hole sizes, ranging from roughly 3mm to 10mm. A well-designed bee buddy structure offers a range of openings.
- A substantial, overhanging roof protects nesting tubes from rain and prevents moisture buildup inside.
- Annual maintenance is non-negotiable. In winter, the tubes should be inspected, cocoons carefully removed and stored, and old or damaged tubes replaced before spring.
The structure should be mounted 3–6 feet off the ground, facing south or southeast to catch morning sun (which helps warm the bees and speeds larval development), and positioned near flowering plants so bees don’t have to travel far to forage.
2. Bee-Friendly Plants
A nesting box alone isn’t enough. Bees need a reliable source of pollen and nectar close to where they nest, ideally available from early spring through fall. This is where intentional planting becomes the real engine of a bee buddy habitat.
Native plants are the gold standard. Native bee species have co-evolved with native flora over thousands of years, meaning their nutritional needs are often best met by local plant species. Ornamental hybrids may look attractive but frequently lack the pollen load or nectar quality that native bees need. Choosing native milkweed, native sunflowers, or native asters over heavily bred cultivars makes a tangible difference.
Succession planting keeps food available all season. The goal is to have something in bloom from early spring well into fall. A few examples across general North American regions:
- Early spring: Crocus, pussy willow, dandelions (yes, dandelions — they are an important early nectar source worth leaving unmowed in patches)
- Late spring/early summer: Wild geranium, blue wild indigo, salvia
- Mid-summer: Coneflower (Echinacea), bee balm (Monarda), lavender, black-eyed Susan
- Late season: Asters, goldenrod (Solidago), Joe Pye weed, ironweed
Grouping plants in clusters rather than scattering singles is more effective — bees can forage more efficiently when flowers are massed together, and clusters are easier for them to spot.
Avoid pesticides. This applies even to products labeled “natural” or “organic.” Pyrethroids and neonicotinoids are particularly harmful to pollinators and can remain in plant nectar and pollen for weeks or longer. When buying plants from a nursery, ask whether they’ve been pre-treated with systemic insecticides — treatments applied before retail sale don’t always show up on labels. Growing from seed from a trusted source is another way to ensure chemical-free plants.
3. A Water Source
Bees need water during foraging and for maintaining the mud they use to seal nesting tubes. This doesn’t require anything elaborate — a shallow dish, a birdbath with stones set just above the water level, or a small tray filled with marbles and water all work well. The stones or marbles give bees a landing platform so they don’t drown. Change the water every few days to prevent mosquito breeding.
How to Set Up a Bee Buddy in Your Garden or Outdoor Space
You don’t need a large yard. A container on a balcony, a window box, or a small patio corner can meaningfully support local pollinators. Here’s a practical sequence:
Step 1: Assess your space. Note how much sun you get, your soil type (if applicable), and what’s already growing. A south-facing space with at least six hours of direct sun is ideal for most pollinator plants.
Step 2: Choose and install a nesting structure. Source or build a bee hotel using the design principles above. Mount it facing south or southeast, 3–6 feet high, near where you’ll be planting.
Step 3: Select native plants suited to your region. Consult your local cooperative extension service, master gardener program, or native plant society for species that are well-matched to your area and growing conditions. Prioritize a mix that spans spring, summer, and fall bloom times.
Step 4: Plant in clusters. Even three to five plants of the same species grouped together is more effective than isolated individual plants scattered around the garden.
Step 5: Add a water source. Place a shallow dish with stones near the planting area. Keep it clean and refilled regularly.
Step 6: Adjust your maintenance habits. Leave some areas of bare or lightly mulched soil — many native bees are ground-nesting and need access to bare earth. In fall, resist the urge to cut everything back immediately; hollow stems and plant debris provide overwintering habitat for beneficial insects. Wait until temperatures have been consistently above 50°F in spring before doing major cleanup.
Step 7: Maintain the nesting structure annually. Each winter, open the tubes, carefully relocate cocoons to a cool, dry location for the winter, and replace or clean the tubes before spring emergence.
Common Misconceptions About Bee Buddies
Bee hotels are always helpful. Not if they’re poorly designed or never maintained. A cheap, plastic-fronted bee hotel left year after year without tube replacement can become a source of parasites and disease rather than a habitat. The structure is only as good as the ongoing care.
You need a large garden to make a difference. A single container with native plants and a small water dish on an apartment balcony can support solitary bee activity, particularly in urban areas where any additional foraging resource matters.
Honeybees are the only bees worth helping. Honeybees are important, but they’re also managed domestically and aren’t facing the same pressures as many native species. Solitary native bees are responsible for a disproportionate share of wild plant pollination and some crop pollination, and they’re the primary beneficiaries of bee buddy interventions.
Leaving your garden “messy” is being lazy. Leaving hollow stems, leaf litter, and patches of bare soil is one of the highest-value things you can do for native pollinators. What looks like neglect is actually deliberate habitat creation. Plenty of native bee species overwinter in hollow plant stems or beneath undisturbed soil.
You need to attract honeybees specifically. A bee buddy setup is most beneficial to native solitary species. Honeybees are generalist foragers that cover large areas and don’t depend on any single garden patch. Native bees tend to have smaller foraging ranges and benefit far more from localized habitat improvements.
Real-World Example: A School Bee Buddy Program
One well-documented application of the bee buddy concept is in educational settings. The Bee Buddies program run through Crown Bees (based in Woodinville, Washington) offers a K–12 student-led learning experience using Mason bees — gentle, regional solitary species that are stingless and easy to observe. Students receive starter kits with bee cocoons, reusable wood nesting trays, and a clay-mud mix for sealing, then track the full pollination cycle on their campus.
Schools that have participated report that students who care for bees develop stronger connections to local ecosystems and food production. When pollination leads to visible fruit and vegetable growth that classrooms then harvest and share, the concept of ecological stewardship becomes something concrete rather than abstract.
This model also works for community gardens, library programs, and neighborhood associations that want to engage residents in hands-on pollinator support without requiring beekeeping expertise.
Key Facts About Bee Buddies and Native Pollinators
- Approximately 90% of the world’s wild flowering plants depend on animal pollinators for reproduction
- The United States has more than 4,000 native bee species, most of which are solitary
- About 70% of solitary bee species nest in the ground; 30% nest in hollow stems or wood cavities
- A residential bee buddy study in Portland, Oregon found a 15% increase in local solitary bee species diversity within two years
- More than 85% of U.S. households have some form of outdoor space that could support pollinator habitat
- The National Research Council concluded in 2007 that 40% of all insect pollinator species were at risk of extinction
- Neonicotinoid pesticides can persist in plant nectar and pollen for weeks to months after application
- Mason bee hotels should be cleaned and tubes replaced annually to prevent parasite buildup
- Native plants provide measurably better nutrition and pollen quality for native bees than ornamental hybrids
FAQ
What is a bee buddy?
A bee buddy is a localized habitat setup designed to support native bees, typically combining a nesting structure (bee hotel), bee-friendly native flowering plants, and a water source. The concept is aimed at individuals, households, schools, and community spaces looking to support pollinator health at a small scale.
Are bee buddies only for people with large gardens?
No. Container gardens on balconies, window boxes, and small patio spaces can all support native bee activity. Even a few pots of native flowering plants alongside a shallow water dish makes a meaningful contribution in urban environments.
Do bee hotels attract stinging bees?
Solitary bee species that use nesting boxes — such as Mason bees and leafcutter bees — are generally non-aggressive and rarely sting. They have no hive to defend. Stings are extremely uncommon and typically only occur if the bee is physically handled or trapped.
How often do bee hotels need maintenance?
Annually, at minimum. In late fall or early winter, tubes should be opened, cocoons carefully removed and stored in a cool, dry location, and old or damaged tubes replaced. Without this, nesting boxes accumulate parasites and pathogens that harm developing larvae.
What plants are best for a bee buddy garden?
Native plant species suited to your specific region are the most effective choice. Good general starting points include coneflower (Echinacea), bee balm (Monarda), goldenrod (Solidago), asters, and native sunflowers. Contact your local cooperative extension service or native plant society for region-specific recommendations.
Can a bee buddy help with vegetable garden pollination?
Yes, directly. Many vegetable crops — including tomatoes, squash, cucumbers, and peppers — benefit from insect pollination. Positioning bee buddy elements near a vegetable garden can improve fruit set and yield.
Is it better to focus on honeybees or native bees?
For a home bee buddy setup, native bees are the primary beneficiaries and generally the better focus. Honeybees are domestically managed and cover large foraging territories. Native solitary bees have smaller ranges and benefit far more from localized habitat improvements.
Key Takeaways
- A bee buddy combines a nesting structure, bee-friendly plants, and a water source to support native pollinators in home and community spaces
- Native solitary bees — not just honeybees — are the primary focus and greatest beneficiaries of these setups
- Design and maintenance of nesting boxes are critical; a poorly maintained bee hotel can do more harm than good
- Native plants provide better pollen and nectar quality for native bees than most ornamental hybrids
- Succession planting ensures food availability from early spring through late fall
- Avoid pesticides, including products marketed as natural or organic — many are toxic to pollinators
- Leave patches of bare soil, hollow stems, and leaf litter for ground-nesting and overwintering species
- Even small spaces — a balcony, a window box, a corner of a patio — can meaningfully support local bee populations
- Annual maintenance of nesting structures is essential for long-term effectiveness
Supporting bees doesn’t require beekeeping knowledge, expensive equipment, or a large piece of land. A thoughtfully placed bee buddy setup — the right nesting structure, a season-long selection of native plants, and a dish of fresh water — is something almost anyone with outdoor access can create. Given how much depends on pollinators continuing to do their work, that’s a genuinely useful place to start.
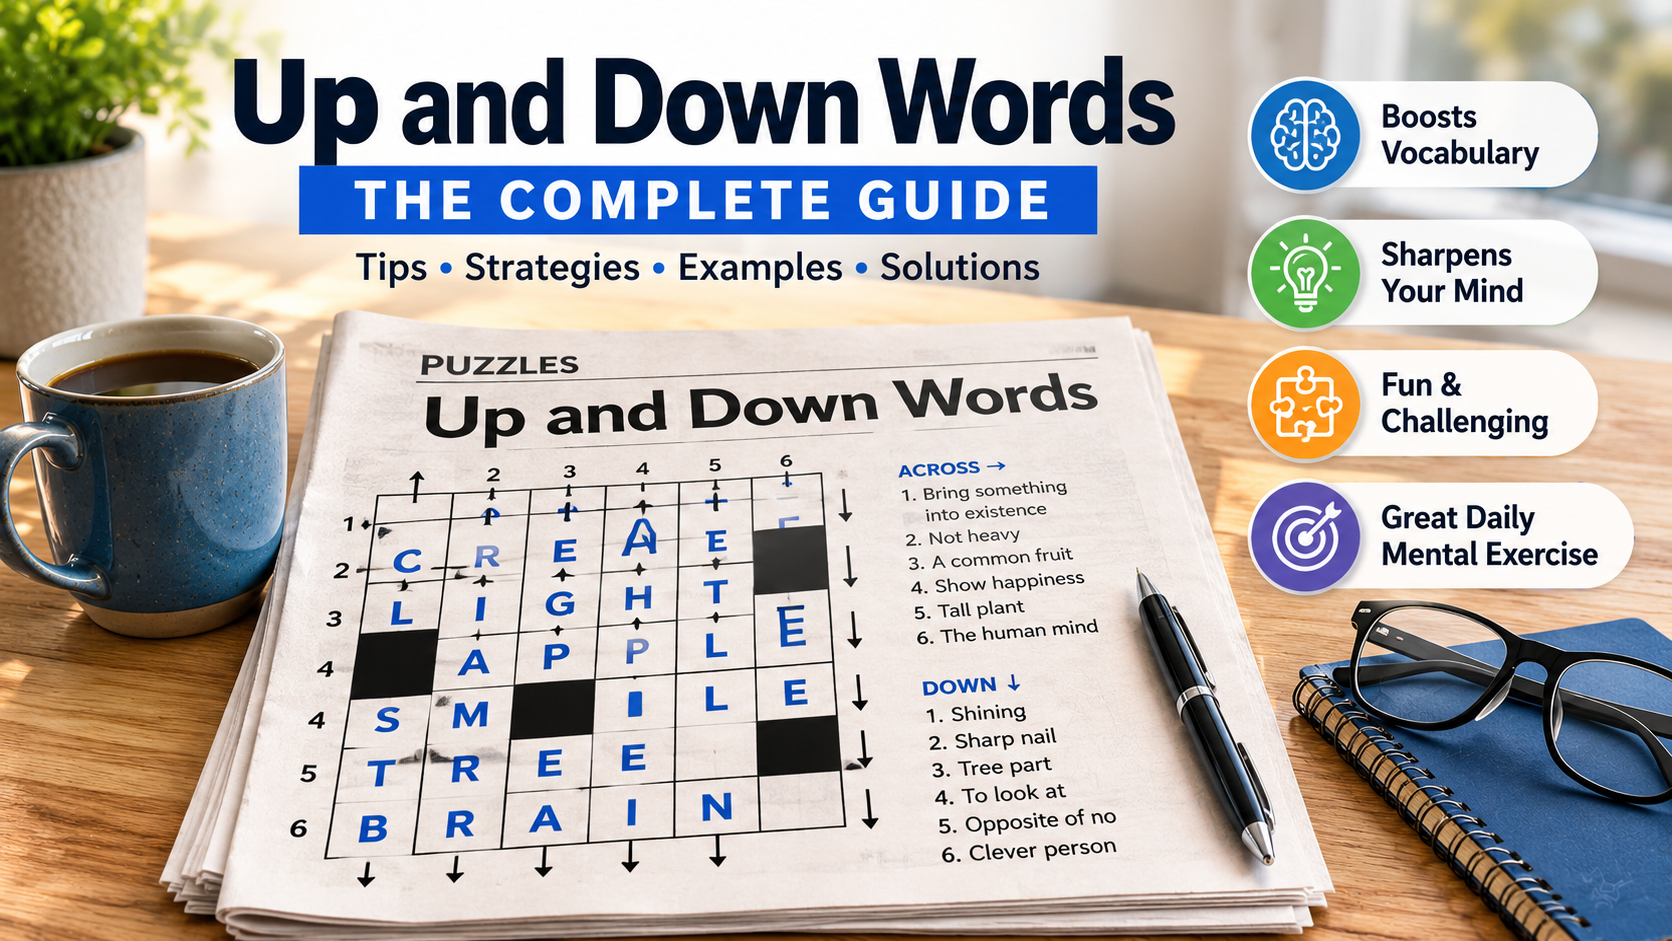
What Are USA Today Up and Down Words?
If you’ve ever flipped through a newspaper or browsed USA Today’s games section, chances are you’ve come across a deceptively simple-looking puzzle grid. USA Today Up and Down Words is a daily word chain puzzle where each answer shares letters with the answers above and below it — creating an interlocking chain of words that tests both vocabulary and lateral thinking.
It sounds easy at first. It rarely is.
Direct Answer
USA Today Up and Down Words is a daily word puzzle where players fill in a grid of two-word answers. Each row contains a two-part word or phrase, and the second word of one answer becomes (or connects to) the first word of the next. The challenge is finding words that satisfy both the clue and the chain link, making it a test of vocabulary, wordplay, and pattern recognition.
How the Puzzle Actually Works
The grid in USA Today Up and Down Words typically has two columns. The left column and right column each contain a word, and together they form a compound word or two-word phrase that answers the clue given for that row.
Here’s the key mechanic: the word in the right column of one row becomes the word in the left column of the next row. So your answers have to work both horizontally (making sense as a phrase) and vertically (linking smoothly from one row to the next).
Think of it like a chain. Each link has to fit the link before it and the link after it. Break the chain anywhere and the whole puzzle falls apart.
A Simple Example
Imagine the clues are:
- Row 1 clue: Place to sleep
- Row 2 clue: Morning drink
- Row 3 clue: Breakfast food
The answers might look like:
- Row 1: BED | ROOM
- Row 2: ROOM | COFFEE (wait — that’s where the chain mechanic gets tricky)
The right-hand word from one row slides into the left-hand position of the next. Players have to find words that work both as phrase completions and as connectors.
The History Behind the Puzzle
USA Today has long been known for making news accessible to a broad American audience — and their puzzle section follows the same philosophy. USA Today Up and Down Words fits that tradition perfectly: the rules take about 30 seconds to learn, but mastering the puzzle can take much longer.
Word chain puzzles have roots going back decades in puzzle culture, appearing in various forms across British and American newspapers. USA Today’s version refined the format into something distinctly modern — clean, quick, and satisfying to complete on a commute or lunch break.
The puzzle gained significant traction as the newspaper expanded its digital games section, making USA Today Up and Down Words available as a free daily online game alongside other favorites like crosswords and Sudoku.
Why So Many People Play It Daily
There’s genuine psychology behind why word puzzles like this one develop loyal daily players.
It’s completable. Unlike a cryptic crossword that can leave you staring at a clue for twenty minutes, Up and Down Words has a clear endpoint. When the chain is complete, you know it.
It creates a small win. Research in behavioral psychology consistently shows that completing small daily challenges — especially ones requiring mild cognitive effort — boosts mood and provides a sense of accomplishment. This puzzle sits in that sweet spot.
It’s social without being competitive. Players share their results, discuss tricky connections, and compare approaches without a leaderboard making anyone feel bad.
It scales with your vocabulary. Whether you have a modest word bank or a rich one, USA Today Up and Down Words meets you where you are. Some days the chain comes together quickly. Other days a single missing link holds everything up.
Common Mistakes Players Make
Even experienced puzzle solvers trip up on this one. Here are the patterns that cause the most trouble:
Locking In Too Early
The most frequent error: you’re confident about a word in the middle of the chain, so you build around it — only to discover it blocks every possible solution for the next row. In USA Today Up and Down Words, staying flexible until the chain is nearly complete is a significant advantage.
Ignoring Compound Word Conventions
Not every two-word combination works as a natural phrase. “FIRE PLACE” works. “FLAME SPOT” doesn’t, even if both words technically connect to heat. The puzzle relies on conventional English compound words and common phrases, not invented combinations.
Focusing Only on One Column
Players often fixate on either the left column or the right column and forget to think about the chain as a whole. The connector words — the ones shared between rows — are where the real puzzle lives.
Overthinking Obscure Vocabulary
USA Today Up and Down Words deliberately uses accessible, everyday words. If you’re reaching for technical jargon or obscure terms, you’ve probably gone in the wrong direction. Back up and look for something simpler.
Strategies That Actually Help
Start With What You Know
Find the clue you’re most certain about and fill in that row completely. Even one confirmed word in the chain creates a foothold.
Work the Connectors
Once you have one row, the shared connector word is partially determined. Focus on what word could logically follow your confirmed answer and lead into a word that satisfies the next clue.
Think in Categories
Common connector words in USA Today Up and Down Words tend to come from specific categories: household objects (DOOR, ROOM, LIGHT), nature (WOOD, STONE, WATER), time references (DAY, NIGHT, MORNING), and actions (FIRE, WALK, WORK). Keeping these categories in mind speeds up your search considerably.
Read the Clues Literally First, Then Loosely
Start with the most literal interpretation of each clue. If that doesn’t produce a workable chain, loosen your interpretation. Puzzle clues often have a slight misdirection built in — the obvious answer isn’t always the right one.
Use the Process of Elimination
If you’re stuck on one row, list every word that could plausibly follow your confirmed connector. Then check each candidate against the next clue. Usually only one or two options survive this test.
How USA Today Up and Down Words Differs From Similar Puzzles
It’s easy to confuse this puzzle with other word games. Here’s how it stands apart:
Versus the Crossword: A crossword intersects words through shared individual letters. USA Today Up and Down Words shares entire words between entries. The mechanic is fundamentally different — and in some ways more constrained.
Versus Word Ladders: Word ladders change one letter at a time to transform one word into another. Up and Down Words doesn’t change words — it chains them. Each word stays intact; what changes is how it’s combined.
Versus Associations Games: Games like NYT Connections ask players to group related words. USA Today Up and Down Words requires building a sequence, not just recognizing relationships. Order matters.
What Makes a Good Solving Session
Experienced players of USA Today Up and Down Words often describe their best sessions as ones where they stay in a relaxed, associative mindset — letting word combinations surface naturally rather than grinding through possibilities methodically.
A few habits that help:
- Saying combinations aloud. Compound words that “feel” right often sound right too. Your ear catches things your eyes miss.
- Taking breaks on hard puzzles. Stepping away for five minutes frequently produces a solution that fifteen minutes of staring didn’t.
- Reviewing past puzzles. The range of connector words used in USA Today Up and Down Words tends to repeat certain patterns. Familiarity with previous puzzles builds intuition for new ones.
Real-World Scenarios: Who Plays This Puzzle?
The player base for USA Today Up and Down Words is genuinely diverse.
A retired teacher in Ohio plays it every morning with coffee, treating it as a mental warm-up. A college student in California uses it as a five-minute study break. A commuter in New York does it on the subway app during the ride downtown.
What they share isn’t age, background, or vocabulary level. It’s a preference for puzzles that reward connection-making over raw knowledge recall. Unlike trivia-based games, you don’t need to know specific facts to solve USA Today Up and Down Words. You need to think flexibly about language — a skill that spans demographics.
Key Facts About USA Today Up and Down Words
- The puzzle is free to play on the USA Today website and app
- A new puzzle is published daily
- The puzzle uses common English compound words and familiar two-word phrases
- Each row contains a two-word answer where one word connects to the adjacent rows
- No account is required to play the standard daily puzzle
- The puzzle appeals to a broad age range due to its accessible difficulty level
- It is part of USA Today’s larger games section, which includes crosswords, Sudoku, and other word games
FAQ
What is USA Today Up and Down Words?
It’s a daily word chain puzzle where each two-word answer shares a connecting word with the answer above or below it. The result is a vertical chain of linked compound words or phrases.
How do you play USA Today Up and Down Words?
Each row has a clue and requires a two-word answer. The second word of one row becomes the first word of the next. Fill in all the rows so the chain connects from top to bottom.
Is USA Today Up and Down Words free?
Yes. The puzzle is available free of charge on the USA Today website and through their games app.
How hard is the puzzle?
Difficulty varies by day. Some puzzles resolve in a few minutes; others require more patience. The challenge level is generally accessible to casual players while still engaging for experienced solvers.
What kind of words appear in the puzzle?
Everyday compound words and common two-word phrases make up the bulk of answers. Technical vocabulary, proper nouns, and obscure terms are rarely used.
Are there hints available?
The digital version of USA Today Up and Down Words typically offers reveal options for individual letters or full words, though using them affects your completion status.
Can I play previous puzzles?
USA Today’s platform generally allows access to a recent archive of past puzzles, though availability can vary based on their current site structure.
What’s the best strategy for beginners?
Start with the clue you feel most confident about, fill in that row completely, and then build outward from your confirmed connector word.
Key Takeaways
- USA Today Up and Down Words is a daily chain puzzle where each answer’s connecting word links vertically to adjacent rows
- The core challenge is finding words that satisfy both the horizontal clue and the vertical chain requirement
- Common mistakes include locking in answers too early and overlooking simple, everyday connector words
- Effective strategies involve starting from confident answers, thinking in word categories, and staying flexible
- The puzzle is free, accessible, and designed for a broad audience regardless of puzzle experience
- Regular play builds familiarity with common connector word patterns, making future puzzles easier to solve
Wrapping Up
USA Today Up and Down Words occupies a specific niche in the daily puzzle world — demanding enough to feel rewarding, approachable enough that finishing is always a realistic goal. It rewards players who think flexibly about language rather than those who simply have large vocabularies.
Whether you’re picking it up for the first time or you’ve been playing for years, understanding the chain mechanic fully changes how you approach each puzzle. Once you stop treating each row as an isolated clue and start thinking about the connectors as the real puzzle, the whole thing opens up.
That shift in perspective — from individual answers to the chain as a whole — is what separates occasional solvers from consistent ones.

Introduction
Family law rarely stands still, and the past twelve months have been unusually active. Across the United States, state legislatures have been updating child custody statutes, revising support formulas, and rethinking how courts handle safety concerns. For parents in the middle of a custody dispute — or those with existing orders — these changes are not abstract. They can affect parenting schedules, monthly payments, and even which parent a court views as the primary caregiver.
This overview of custody law news covers the most significant changes in 2025 and 2026, explains what they mean in practical terms, and addresses the questions parents most commonly ask when laws shift under their feet.
Note: This article is general information and not a substitute for legal advice specific to your situation. Laws vary by state. Always consult a licensed family law attorney in your jurisdiction.
Direct Answer: What Is Happening in Custody Law Right Now?
Custody law news in 2025–2026 centers on several major themes: states are increasing emphasis on child safety over automatic shared parenting, child support formulas are being updated to reflect modern income levels and living costs, courts are giving more weight to children’s expressed preferences, and digital tools are streamlining how parents file and modify custody orders. New Jersey, California, Georgia, and Texas have all enacted meaningful changes.
Why Custody Laws Are Changing Now
Child custody law has historically been slow to change — statutes written decades ago often governed cases well into the 21st century. Several forces have pushed legislatures to act more recently.
First, economic reality has outpaced older formulas. Child support calculations based on income data from the early 2000s no longer reflect what it costs to raise a child. States are revising their models to catch up.
Second, research on child development has shifted professional consensus. Evidence increasingly shows that high-conflict custody arrangements cause measurable harm to children. Courts are responding by emphasizing cooperation and safety rather than simply maximizing contact with both parents.
Third, domestic violence advocates have successfully pushed for stronger protections. Laws in multiple states now make it harder for an abusive parent to receive joint custody without clear evidence that the arrangement is safe.
New Jersey: Child Safety Now Comes First
One of the most significant pieces of recent custody law news comes from New Jersey. In January 2026, New Jersey enacted amendments to N.J.S.A. 9:2-4, the statute courts use when deciding child custody and parenting time. The changes place greater emphasis on child safety, require courts to consider children’s preferences more directly, limit certain court-ordered therapy and reunification programs, and require judges to make more detailed findings in contested custody cases.
What does this mean in practice? Previously, New Jersey law emphasized “frequent and continuing contact” with both parents as a default goal. The prior statutory emphasis on frequent and continuing contact with both parents has been removed. Child safety is now treated as a threshold concern.
For parents with safety concerns — whether involving domestic violence, substance abuse, or other risk factors — this is meaningful custody law news. Courts are now required to address those concerns head-on before determining parenting time, rather than treating them as factors to weigh alongside other considerations.
Mental health professionals involved in custody-related therapy must now meet licensing and, in some cases, specialized training requirements. The changes apply to pending and future custody matters, although existing custody orders are not automatically changed.
California: Sweeping Family Law Reforms
California produced some of the most wide-ranging custody law news in recent years, with changes affecting everything from how domestic violence is treated in custody cases to how child support is calculated.
Domestic Violence and Custody
A key 2025 update strengthens the rebuttable presumption against joint custody in cases involving domestic violence. If a parent has committed abuse, the court is less likely to award shared custody unless clear evidence shows it’s safe for the child. The new laws also increase access to restraining orders and expand judicial training requirements.
Updated Child Support Formula
California’s child support calculation underwent a significant overhaul. The state dramatically overhauled its child support laws and made changes to the child support formula. Key updates include an updated formula under SB 343 to reflect modern income levels and living costs, a raised income threshold for low-income protections now applying to those earning up to approximately $2,900 per month, and support suspension for incarcerated parents — support may pause during incarceration and resume ten months after release.
Courts can also now direct child support into special needs trusts to protect disabled children’s public benefits, and parents earning less than 70 percent of the Area Median Income are shielded from driver’s license suspension for nonpayment.
Spousal Support and Tax Changes
SB 711 changes how spousal support is treated for tax purposes beginning in 2026. Because guideline child support and spousal support both rely on income, tax changes can ripple through the entire support picture. Parents with existing orders may find that a modification is warranted simply because the tax treatment of their support payments has shifted.
Georgia: New Worksheets and Parenting Time Adjustments
Georgia families following custody law news have several changes to track, most of which took effect January 1, 2026.
Beginning January 1, 2026, a new child support worksheet replaced the existing formula, providing a more straightforward and equitable process for calculating support amounts. The 2026 updates also provide a clearer definition of the custodial parent, particularly in cases where children spend equal or nearly equal time with both parents.
A parenting time adjustment now accounts for the actual time a child spends with each parent when calculating child support obligations. This change ensures that child support payments more accurately reflect each parent’s involvement in childcare, potentially reducing the financial burden on noncustodial parents who maintain significant parenting time.
Georgia also addressed veterans’ benefits. Veterans’ disability benefits will be treated as credits in support calculations, preventing double-counting against disabled veterans.
Texas: Higher Income Cap for Support Calculations
Texas custody law news in 2025 centered on one specific but financially significant change. The primary change to child support laws in Texas concerns the maximum amount of monthly income that courts may assess when calculating child support payments. Family courts in Texas could previously only assess up to $9,200 in net monthly income. Due to Texas House Bill 2643, courts now consider net income up to $11,700 per month.
These changes to child support laws only apply to new cases and child support modifications filed on or after September 1, 2025.
Texas also enacted two bills affecting parental rights more broadly. Senate Bill 1936 revamps the rights of noncustodial parents and their ability to gain access to visitation schedules, giving these parents more opportunities to visit their children outside of the regular workweek.
National Trends Shaping Custody Law News
Beyond individual states, several national trends are shaping where custody law is heading.
Shared Custody Is the Default in More States
Courts now increasingly favor joint custody to ensure that both parents have an equal role in decision-making and time spent with the child. Laws have become more comprehensive in defining the “best interests of the child,” including considering the child’s emotional, mental, and physical needs, their relationship with each parent, and their preferences depending on their age and maturity.
This does not mean shared custody is automatic — particularly where safety concerns exist — but the baseline presumption in many states has shifted toward involvement of both parents.
Children’s Voices Carry More Weight
Multiple states, including New Jersey, have updated their statutes to give children’s expressed preferences more formal weight in custody proceedings. The age and maturity of the child typically determine how much influence their preference carries. In Georgia, for example, children who are fourteen or older may express a preference, but the judge still decides. Younger children may also share input if the court allows it.
Non-Traditional Families Are Getting More Recognition
Custody laws have become more inclusive of non-traditional families, including unmarried parents, same-sex couples, and blended families. California’s 2026 changes specifically address situations involving three-parent families and long-term partners who have functioned as a parent without formal legal status.
Digital Processes Are Replacing Paper
One of the quieter but practically significant pieces of custody law news is administrative. Multiple states have moved custody and support processes fully online — from permit applications to ownership transfers of support orders. This reduces delays, lowers costs, and makes it easier for parents without legal representation to navigate the system
Common Misconceptions About Custody Law
“Courts always favor mothers.” This is no longer accurate in any US jurisdiction. Fathers’ rights are the same as mothers’ in regard to child support. Courts focus on factors like income and involvement, not the gender of the parent. That said, historical patterns sometimes influence outcomes, which is why legal representation matters.
“50/50 custody means no child support.” Not necessarily. Even in 50/50 splits, child support may be paid if there is a difference in parents’ income levels or health-related issues. Courts calculate support based on income disparity, not just time.
“An existing custody order can’t be changed.” Orders can be modified when circumstances change. Georgia allows modifications if there is a material change in circumstances such as school issues, relocation, safety concerns, or major schedule changes. Most states have similar provisions.
“New laws automatically change my existing order.” They typically do not. Existing custody orders are not automatically changed by new legislation. A parent who believes a new law affects their situation must generally file for a modification.
Key Facts About Custody Law in 2025–2026
- New Jersey removed the default preference for “frequent and continuing contact” with both parents, making child safety the primary threshold.
- California’s updated child support formula under SB 343 accounts for modern income levels, gig work, and inflation.
- Georgia’s new child support worksheet, effective January 1, 2026, factors in actual parenting time when calculating obligations.
- Texas raised the income cap for child support calculations from $9,200 to $11,700 in net monthly income, effective September 2025.
- Multiple states are strengthening presumptions against joint custody in domestic violence cases.
- Children’s preferences are receiving more formal statutory recognition, particularly for teenagers.
- Veterans’ disability benefits are now treated as credits, not income, in several states’ child support calculations.
FAQ: Custody Law News
Can I modify my existing custody order based on new laws?
New laws do not automatically change existing orders. You typically need to file a modification petition and demonstrate a material change in circumstances. Consult a family law attorney in your state to assess whether recent changes give you grounds to seek a modification.
Do fathers have equal rights in custody cases?
Yes, legally. Courts are required to evaluate both parents equally based on the best interests of the child. In practice, outcomes depend on factors like involvement, stability, and cooperation — not gender.
What is “best interests of the child” and how is it determined?
It is the legal standard courts use to decide custody and parenting time. Factors typically include each parent’s relationship with the child, stability of the home environment, the child’s own preferences (depending on age), each parent’s ability to support the other’s relationship with the child, and any safety concerns.
How do domestic violence allegations affect custody?
They can significantly restrict the alleged abuser’s parenting time or require supervised visitation. California and New Jersey have both strengthened their presumptions against joint custody when domestic violence has occurred.
What is joint legal custody versus joint physical custody?
Legal custody refers to decision-making authority — schools, medical care, religious upbringing. Physical custody refers to where the child lives. Parents can share one without sharing the other. Many courts award joint legal custody even when physical custody is primarily with one parent.
How often can child support be modified?
Most states allow modifications when there is a substantial change in circumstances — a significant income change, a shift in parenting time, or a change in the child’s needs. Some states allow automatic reviews every few years.
Does the child’s preference determine custody?
Not alone. A child’s preference is one factor courts consider, and its weight depends on the child’s age and maturity. In most states, judges have final discretion regardless of what the child expresses.
Key Takeaways
- The biggest custody law news of 2025–2026 involves a national shift toward child safety over automatic shared parenting, particularly in domestic violence cases.
- New Jersey, California, Georgia, and Texas have all enacted significant changes to either custody statutes or child support formulas.
- Child support calculations are being updated across states to reflect current income levels, living costs, and modern work patterns including gig employment.
- Children’s preferences are receiving more statutory weight, especially for teenagers.
- Existing custody orders are not changed automatically by new laws — a formal modification process is required.
- Non-traditional families, veterans, and low-income parents are receiving more targeted legal protections under the most recent reforms.
- Digital filing and online processes are making it easier for parents to navigate the system without extensive legal bureaucracy.
Custody law is ultimately about children — their stability, safety, and relationships with the people who raise them. The legislative activity of 2025 and 2026 reflects a genuine effort by states to update frameworks that in some cases had not meaningfully changed in decades. For parents navigating these systems, staying current with custody law news is not just useful — it can directly affect the outcome of a case. When in doubt, consulting a licensed family law attorney in your state remains the most reliable way to understand how any of these changes apply to your specific situation.
-

 Lifestyle3 weeks ago
Unblocked Games: What They Are, How They Work, and What to Watch For
-

 Lifestyle3 weeks ago
Russia-Ukraine Ceasefire: What’s Been Agreed, What Hasn’t, and Where Talks Stand
-

 News2 weeks ago
Was Kash Patel Removed? What the Search Actually Means
-

 News2 weeks ago
Falconry News: What’s Happening in the World of Hawking Right Now
-

 News2 weeks ago
The Hubble Birthday Tradition: How NASA Celebrates the Space Telescope’s Anniversary Every Year
-

 News7 days ago
Ted Danson Blackface: What Happened and Why It’s Still Discussed
-

 Lifestyle2 weeks ago
Gulf of Oman: Geography, Importance, and Everything You Need to Know
-

 Technology2 weeks ago
How to Say Dad in Korean: Every Word, Form, and Context You Need