
Sports
Maduro Nike Tech: The Story Behind the Viral Tracksuit Photo

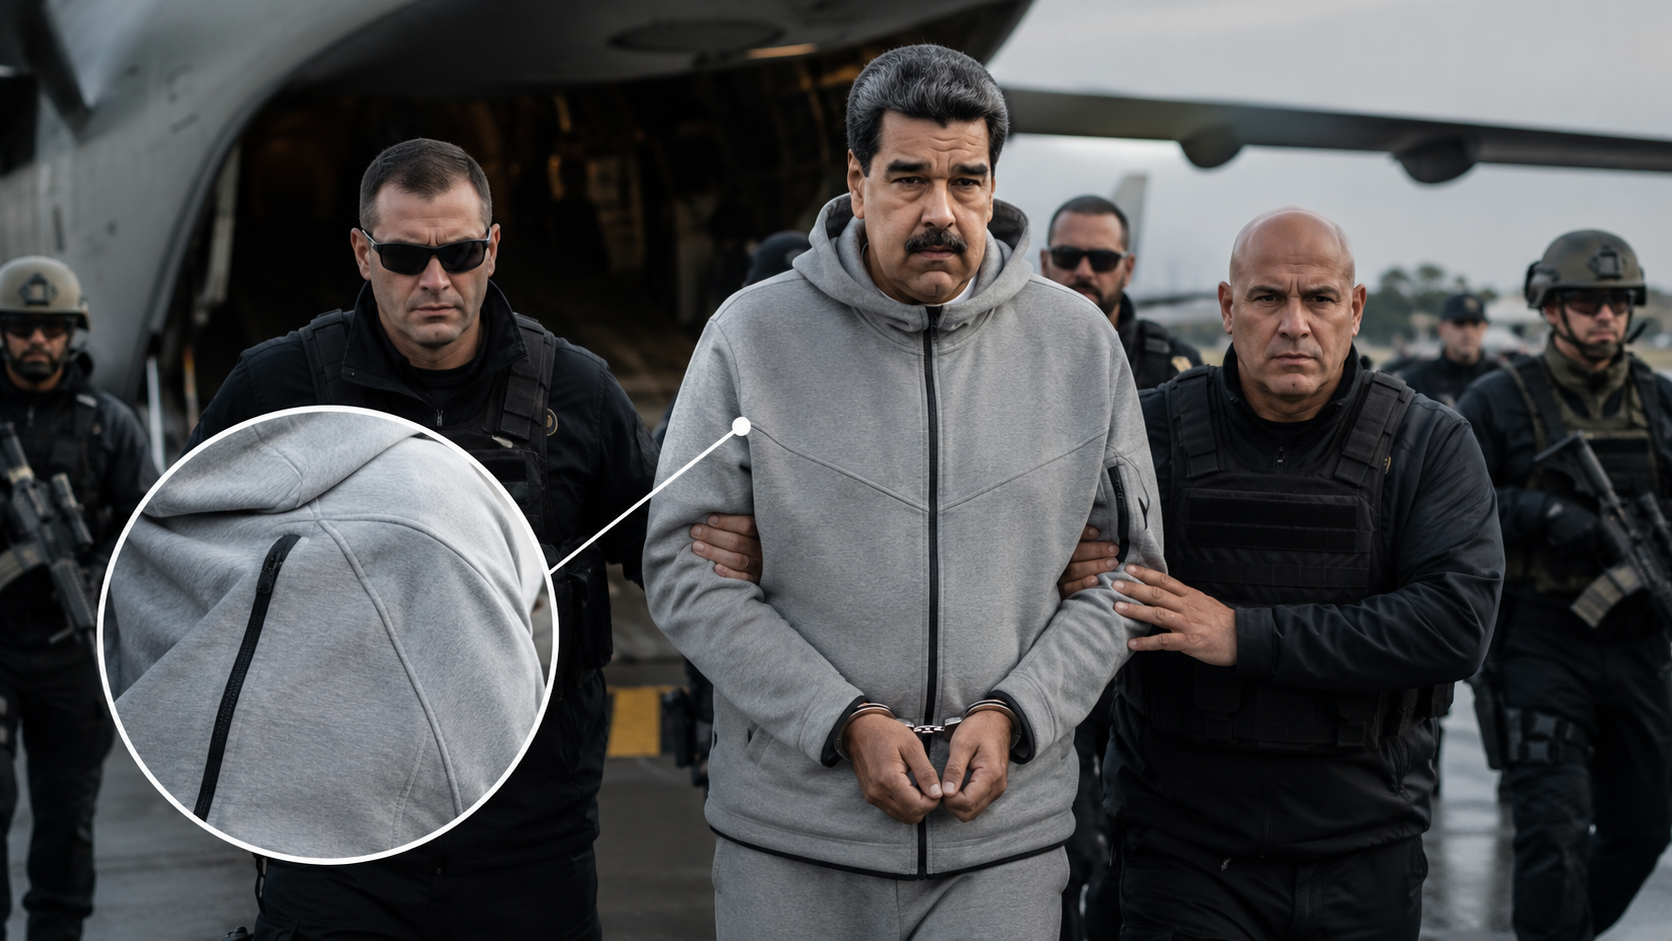
A single photograph turned a global political story into an unlikely fashion moment. When people search “maduro nike tech,” they’re usually trying to understand how a Venezuelan president ended up trending alongside a $140 sweatsuit, and why the internet couldn’t stop talking about it.
Direct Answer
“Maduro Nike Tech” refers to a viral photo from January 3, 2026, showing Venezuelan President Nicolás Maduro in U.S. custody wearing a gray Nike Tech Fleece tracksuit aboard the USS Iwo Jima. President Trump shared the image on Truth Social after Maduro’s capture in Caracas. The tracksuit sold out within hours as online searches and social media reactions surged worldwide.
What Happened on January 3, 2026
Maduro and his wife, Cilia Flores, were captured during an overnight raid in Caracas and flown to the United States, where they faced federal charges and later pleaded not guilty. According to reporting from KGW, Maduro was transported by helicopter to the USS Iwo Jima before continuing to New York.
The image that circulated showed Maduro blindfolded, wearing noise-canceling headphones, and dressed in a gray Nike Tech Fleece Windrunner jacket and matching joggers. It was a jarring combination: a moment of serious political consequence, framed by one of the most recognizable pieces of streetwear on the market.
Why the Nike Tech Tracksuit Became the Story
The Nike Tech Fleece line isn’t a random athletic set. It has real cultural weight, especially among younger buyers. The tracksuit has been worn by rappers, athletes, and everyday streetwear fans, and it’s become something close to a uniform in cities like New York. That existing reputation is a big part of why the maduro nike tech pairing spread so fast. People recognized the outfit instantly, and the contrast between the clothing and the circumstances made it impossible to ignore.
Search interest in “Nike Tech” spiked immediately after Trump’s Truth Social post. Multiple outlets reported that the tracksuit sold out at major retailers within days, though it was reportedly back in limited stock within about a week.
The Cultural Debate It Reignited
The moment also revived an ongoing, mostly lighthearted online debate among young men about style tribes, jokingly split into “team Nike Tech” versus “team quarter-zip.” The Maduro photo dropped directly into that existing conversation, which helped it spread even faster than a typical news image would have.
How Analysts Read the Image
A Time Ideas piece on the photo argued that dressing a politically consequential figure in casual athleisure changed how the moment was absorbed. The argument, in short: uniforms and formal dress usually signal state power and consequence, while a recognizable sportswear logo signals leisure and familiarity. Putting the two together didn’t erase the seriousness of the event, but it made the image easier to process, share, and meme rather than sit with.
That’s a media-analysis interpretation, not a settled fact, and other observers focused less on symbolism and more on the simple novelty of the outfit choice itself.
Where the Tracksuit Actually Came From
One detail that fueled speculation was whether the outfit had been “planted” or was somehow tied to a marketing stunt. Reporting from The Banner traced part of that theory: a composite image comparing Maduro’s photo to a stock photo of a Nike Tech Fleece model wearing the same colorway circulated online, and the model in that stock photo had shot the campaign more than a year earlier, in October 2024, for a retailer in Maryland. That timeline makes a coordinated marketing stunt unlikely, since the stock photography predated the custody photo by well over a year. Nike itself did not participate in or comment on the moment.
Nike’s Response
Unlike brands that typically try to capitalize on unexpected viral attention, Nike stayed silent. Marketing coverage from Digiday noted that Nike declined to comment and did not engage with the moment on social media, despite the company’s history of leaning into cultural moments. Industry analysts framed the silence as a deliberate choice, since the image was tied to a politically sensitive event rather than a typical pop-culture moment a sportswear brand could safely join.
How the Internet Reacted
Social listening data reported by Digiday, drawn from an analysis of hundreds of social video posts reaching hundreds of millions of views, found the tone of the conversation was overwhelmingly neutral. Most posts fell into meme remixes, “sold out” reaction content, and “steal his look” style videos rather than pointed political commentary. Negative reactions appeared mainly in the first day and faded quickly, while the dominant conversation shifted toward demand and scarcity rather than politics.
Common Mistakes and Misconceptions
Assuming the tracksuit was staged as marketing. No verified evidence supports this. The stock-photo comparison that fueled the theory involved a shoot from over a year before the event.
Assuming Nike promoted the moment. Nike didn’t post about it, comment on it, or otherwise participate. The attention was entirely organic and, from the brand’s side, unwanted.
Treating the photo as confirmation of specific U.S. government actions. The image itself shows Maduro’s attire; broader details about the operation and legal proceedings came from separate reporting and official statements, and those facts developed over the following days and weeks.
Confusing “Nike Tech” with a single specific product. Nike Tech Fleece is a clothing line with multiple jacket and jogger styles and colorways, not one single item. The gray Dark Grey Heather colorway is the specific version tied to this moment.
Real-World Example: The Resale Market Response
Within days of the photo circulating, listings referencing the moment appeared on resale platforms like eBay, some explicitly labeled with the “Maduro” name to capitalize on search interest. Independent retailers also began marketing the same gray colorway under names like the “Maduro Fit,” selling it as a piece of viral, current-events fashion history rather than as ordinary athletic wear. This kind of rapid resale and rebranding response is a common pattern whenever an object becomes attached to a major news event, similar to how specific items connected to past viral moments have been resold under event-specific names.
Key Facts
- The viral photo was shared by President Trump on Truth Social on January 3, 2026.
- Maduro was shown wearing a gray Nike Tech Fleece Windrunner jacket and matching joggers.
- The tracksuit reportedly sold out at multiple retailers within hours of the photo circulating.
- Nike did not comment publicly and did not participate in the viral moment.
- Social media sentiment around the moment was overwhelmingly neutral, centered on memes and demand rather than political commentary.
- Maduro and his wife, Cilia Flores, were reported to have pleaded not guilty to federal charges after the capture.
FAQ
What is “maduro nike tech”?
It’s shorthand for the viral moment where Nicolás Maduro appeared in a gray Nike Tech Fleece tracksuit in a photo taken during his transfer into U.S. custody in January 2026.
Did Nike sponsor or plan this?
No confirmed evidence supports that. Nike declined to comment and did not engage with the moment publicly.
Why did the tracksuit sell out?
A sudden, massive spike in public curiosity and social media attention drove demand faster than retailers could restock, a common pattern when an item becomes attached to a viral news event.
Is the outfit still available?
Reporting from shortly after the event indicated the tracksuit came back into limited stock within about a week, though availability can vary by retailer and size.
Was the photo verified?
The image was shared by President Trump and widely reported by major outlets, though some coverage described the underlying image and details of the custody transfer as still developing in the days that followed.
Why did this become such a big cultural moment?
The combination of a serious political event with an instantly recognizable, everyday clothing brand created a contrast that was easy to notice, discuss, and meme, which is part of why it spread so widely across social platforms.
Key Takeaways
- “Maduro Nike Tech” refers to the viral January 2026 photo of Nicolás Maduro in a gray Nike Tech Fleece tracksuit during his transfer to U.S. custody.
- The tracksuit’s existing cultural status in streetwear helped the image spread quickly and become memeified.
- Nike stayed silent and did not participate in the moment, unlike its usual approach to viral cultural attention.
- Theories that the outfit was staged or sponsored aren’t supported by verified evidence.
- Online reaction was largely neutral, driven by meme culture and demand rather than political debate.
Conclusion
The maduro nike tech moment shows how quickly a single image can shift public attention from a serious political event to an everyday consumer product. A tracksuit that normally signals nothing more than comfort and style became, for a few weeks in early 2026, one of the most talked-about pieces of clothing in the world, simply because of where and on whom it appeared.
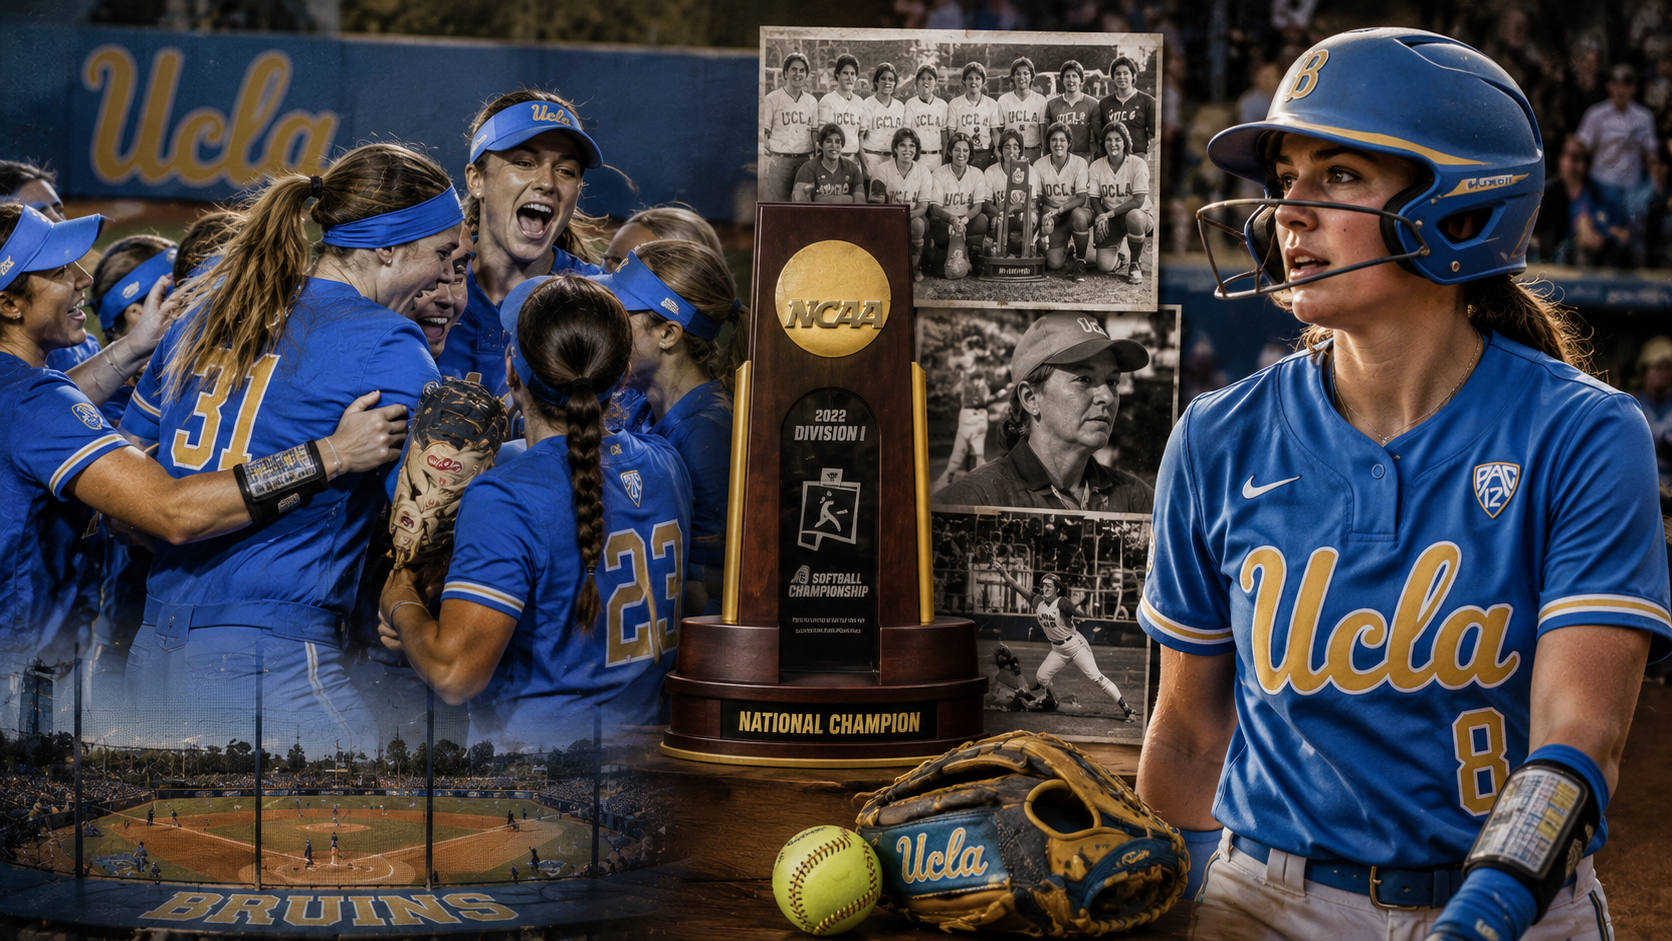
When people talk about college softball, UCLA comes up almost immediately — and for good reason. The Bruins have spent decades at the top of the sport, winning national championships at a rate that few programs in any collegiate sport can match. Whether you’re a longtime fan, a prospective student-athlete, or someone just getting into softball, understanding what UCLA has built gives you a clear picture of what sustained excellence in college athletics actually looks like.
What Is UCLA Softball?
UCLA softball is the women’s softball program of the University of California, Los Angeles, competing in the Pac-12 Conference as part of NCAA Division I athletics. The program plays its home games at Easton Stadium on the UCLA campus in Los Angeles, California, and is consistently ranked among the top programs in the country.
Since its founding, UCLA softball has become the standard by which other programs measure themselves — a program defined by championships, Olympians, and a coaching legacy that shaped the sport nationally.
Quick Answer: Why Is UCLA Softball So Successful?
UCLA softball is widely considered the most successful program in college softball history, with 13 NCAA national championships. Its success stems from elite recruiting, a tradition that attracts top talent, outstanding coaching, and a culture of competitive excellence built over decades. The program has produced numerous Olympic athletes and All-Americans and plays in one of the strongest conferences in the sport.
Program History and Foundation
UCLA introduced its softball program in 1975, arriving at a formative moment for women’s collegiate athletics. Title IX, passed in 1972, had begun opening doors for women’s sports programs across American universities, and UCLA moved quickly to build something serious.
The early years established the program’s competitive identity. By the 1980s, UCLA was already winning national championships and signaling that this wasn’t going to be a program that competed — it was going to be one that dominated.
Head coach Sharron Backus built the foundation. In her tenure running through 1996, UCLA won six national championships, establishing the program’s identity around pitching, defense, and disciplined team play. The standard she set shaped everything that followed.
The Sue Enquist Era and Program Expansion
When Sue Enquist took over as head coach in 1989 — initially sharing duties with Backus before becoming the sole head coach — UCLA softball entered a new phase. Enquist had played for the Bruins before coaching them, giving her a firsthand understanding of what the program’s culture required.
Under Enquist, UCLA added five more national championships to its total, finishing her tenure in 2006 with an 11-national-championship run between her and Backus. That back-to-back coaching continuity — both coaches deeply invested in the program’s specific identity — is one of the less-discussed reasons for UCLA’s sustained dominance. The culture didn’t reset every few years with a new hire. It compounded.
Enquist was also notable for her emphasis on mental performance and team culture alongside technical development. Her coaching philosophy extended well beyond the field, and many of the players she developed have gone on to coaching careers of their own, spreading UCLA’s influence throughout the sport.
National Championships: The Record
UCLA softball has won 13 NCAA Division I national championships, more than any other program in the sport’s history. Those titles span multiple decades and multiple coaching staffs, which distinguishes UCLA’s success from a single era of dominance.
The championship years: 1978, 1982, 1984, 1985, 1988, 1989, 1992, 1993, 1995, 1999, 2003, 2004, and 2010.
That list tells a specific story. UCLA wasn’t just good in one era — it was good across eras. Programs that win one or two national titles often do so on the back of a single exceptional recruiting class or a dominant pitcher. Winning 13 across four decades requires something more structural: a recruiting pipeline, a coaching culture, and a program environment that consistently produces at the highest level.
Where UCLA Softball Plays: Easton Stadium
UCLA softball plays at Easton Stadium, located on the UCLA campus in Westwood, Los Angeles. The facility underwent a significant renovation and expansion in 2006, giving the program one of the most modern and well-equipped venues in college softball.
Easton Stadium seats over 1,400 fans and features amenities that reflect the program’s status — press facilities, modern dugouts, and a playing surface that meets the standards of a program regularly hosting NCAA regional and super regional competition.
For recruits and fans alike, the venue matters. A high-quality home facility signals institutional commitment to the program, which feeds recruiting success, which feeds championships.
Notable Players and Olympic Connections
UCLA softball has an unusually strong connection to the United States Olympic softball program. The list of Bruins who have represented the U.S. at the Olympics is long, and it reflects both the talent the program attracts and the development it provides.
Some of the most notable names from UCLA’s history include:
Lisa Fernandez — arguably the most dominant pitcher in the history of the sport. Fernandez played for UCLA in the early 1990s, winning two national championships, and went on to a legendary Olympic career that included three gold medals (1996, 2000, 2004) with Team USA. Her combination of pitching and hitting ability set a standard that defined the position for a generation.
Stacey Nuveman — a three-time All-American catcher and two-time Olympic gold medalist who played for UCLA in the late 1990s and early 2000s. Her power at the plate was exceptional for the era.
Rachel Garcia — a two-way player (pitcher and utility) who won two national championships at UCLA in 2019 and helped lead the program’s resurgence in the late 2010s. Garcia earned USA Softball Player of the Year honors and competed at the Tokyo Olympics in 2021.
These aren’t isolated examples. UCLA has produced a steady stream of players who moved directly from Westwood into elite national and international competition.
The Pac-12 Conference and Competitive Landscape
UCLA competes in the Pac-12 Conference, which has historically been one of the strongest conferences in college softball. Conference opponents including Arizona, Arizona State, Oregon, and Washington regularly rank among the nation’s top programs, meaning UCLA faces elite competition before the postseason even begins.
That conference environment has both challenged and strengthened the program. Playing against top competition weekly sharpens rosters in ways that easier conference schedules don’t. UCLA’s national championship pedigree has been tested and forged in one of the most demanding regular-season environments the sport offers.
Common Misconceptions About UCLA Softball
“UCLA’s success is just about recruiting star players.” Recruiting matters, but program development matters more over the long run. Several of UCLA’s most celebrated players came in as prospects who reached their potential through the program’s coaching and culture rather than arriving as fully finished products.
“The program peaked years ago.” UCLA’s 2019 national championship — the program’s 13th — came under head coach Kelly Inouye-Perez, who took over in 2007. The program has remained nationally competitive year after year, consistently reaching the NCAA Tournament and contending for Pac-12 titles.
“Softball programs all look the same at the top level.” There’s meaningful variation in program identity across elite softball. UCLA’s emphasis on pitching depth, defensive fundamentals, and team culture creates a specific style of play that differs from other top programs.
Key Facts
- UCLA softball has won 13 NCAA Division I national championships — the most in program history.
- The program was founded in 1975, shortly after Title IX transformed women’s collegiate athletics.
- Home games are played at Easton Stadium on the UCLA campus in Los Angeles.
- Notable alumni include Olympic gold medalists Lisa Fernandez, Stacey Nuveman, and Rachel Garcia.
- UCLA competes in the Pac-12 Conference, one of the strongest in college softball.
- Head coaches Sharron Backus and Sue Enquist account for 11 of the program’s 13 national titles between them.
- Kelly Inouye-Perez, who played for UCLA before coaching there, won the program’s most recent national title in 2019.
Frequently Asked Questions
How many national championships has UCLA softball won?
UCLA softball has won 13 NCAA Division I national championships, more than any other program in the sport’s history.
Who are the most famous players in UCLA softball history?
Lisa Fernandez, Stacey Nuveman, and Rachel Garcia are among the most celebrated. Fernandez in particular is widely considered one of the greatest softball players ever to play the game.
Where does UCLA softball play its home games?
At Easton Stadium on the UCLA campus in Westwood, Los Angeles, California.
Who coaches UCLA softball?
Kelly Inouye-Perez has been the head coach since 2007, following the legendary tenure of Sue Enquist. Inouye-Perez played for UCLA before transitioning into coaching.
What conference does UCLA softball compete in?
The Pac-12 Conference, one of the most competitive conferences in college softball.
Has UCLA softball been to the Olympics?
UCLA hasn’t competed as a team in the Olympics — that’s a national team competition — but the program has produced more Olympic softball players than virtually any other college program. Lisa Fernandez, Stacey Nuveman, Rachel Garcia, and others all played for UCLA before representing the United States at the Olympics.
Is UCLA softball still competitive today?
Yes. The program consistently ranks among the top programs nationally, competes for Pac-12 titles regularly, and appears in the NCAA Tournament each year.
Key Takeaways
- UCLA softball is the most decorated program in college softball history with 13 national championships spanning four decades.
- The program’s success is rooted in coaching continuity, a strong recruiting pipeline, and a competitive culture built over 50 years.
- Easton Stadium provides a top-tier home facility in Los Angeles that supports recruiting and fan engagement.
- The program has produced an extraordinary number of Olympic athletes, including Lisa Fernandez, one of the greatest softball players of all time.
- Competing in the Pac-12 Conference means UCLA faces elite competition throughout the regular season, which has sharpened the program year after year.
- Under current head coach Kelly Inouye-Perez, the program won its most recent national title in 2019 and has remained a consistent national contender.
Wrapping Up
UCLA softball isn’t just a successful program — it’s the benchmark the rest of the sport uses to measure itself. Thirteen national championships, a roster of Olympic alumni, and more than five decades of competing at the highest level tell a story about what sustained institutional commitment to a program actually produces. The results haven’t come from any single coach, player, or era. They’ve come from building something that outlasts all of them — and keeps producing.
-
 Lifestyle3 weeks ago
Unblocked Games: What They Are, How They Work, and What to Watch For
-
 News2 weeks ago
Falconry News: What’s Happening in the World of Hawking Right Now
-

 Lifestyle3 weeks ago
Russia-Ukraine Ceasefire: What’s Been Agreed, What Hasn’t, and Where Talks Stand
-
 News2 weeks ago
Was Kash Patel Removed? What the Search Actually Means
-

 News2 weeks ago
The Hubble Birthday Tradition: How NASA Celebrates the Space Telescope’s Anniversary Every Year
-

 Lifestyle2 weeks ago
Gulf of Oman: Geography, Importance, and Everything You Need to Know
-
 News1 week ago
Ted Danson Blackface: What Happened and Why It’s Still Discussed
-
 Technology2 weeks ago
How to Say Dad in Korean: Every Word, Form, and Context You Need